


Business intelligence
Your whole network, in one clear view.
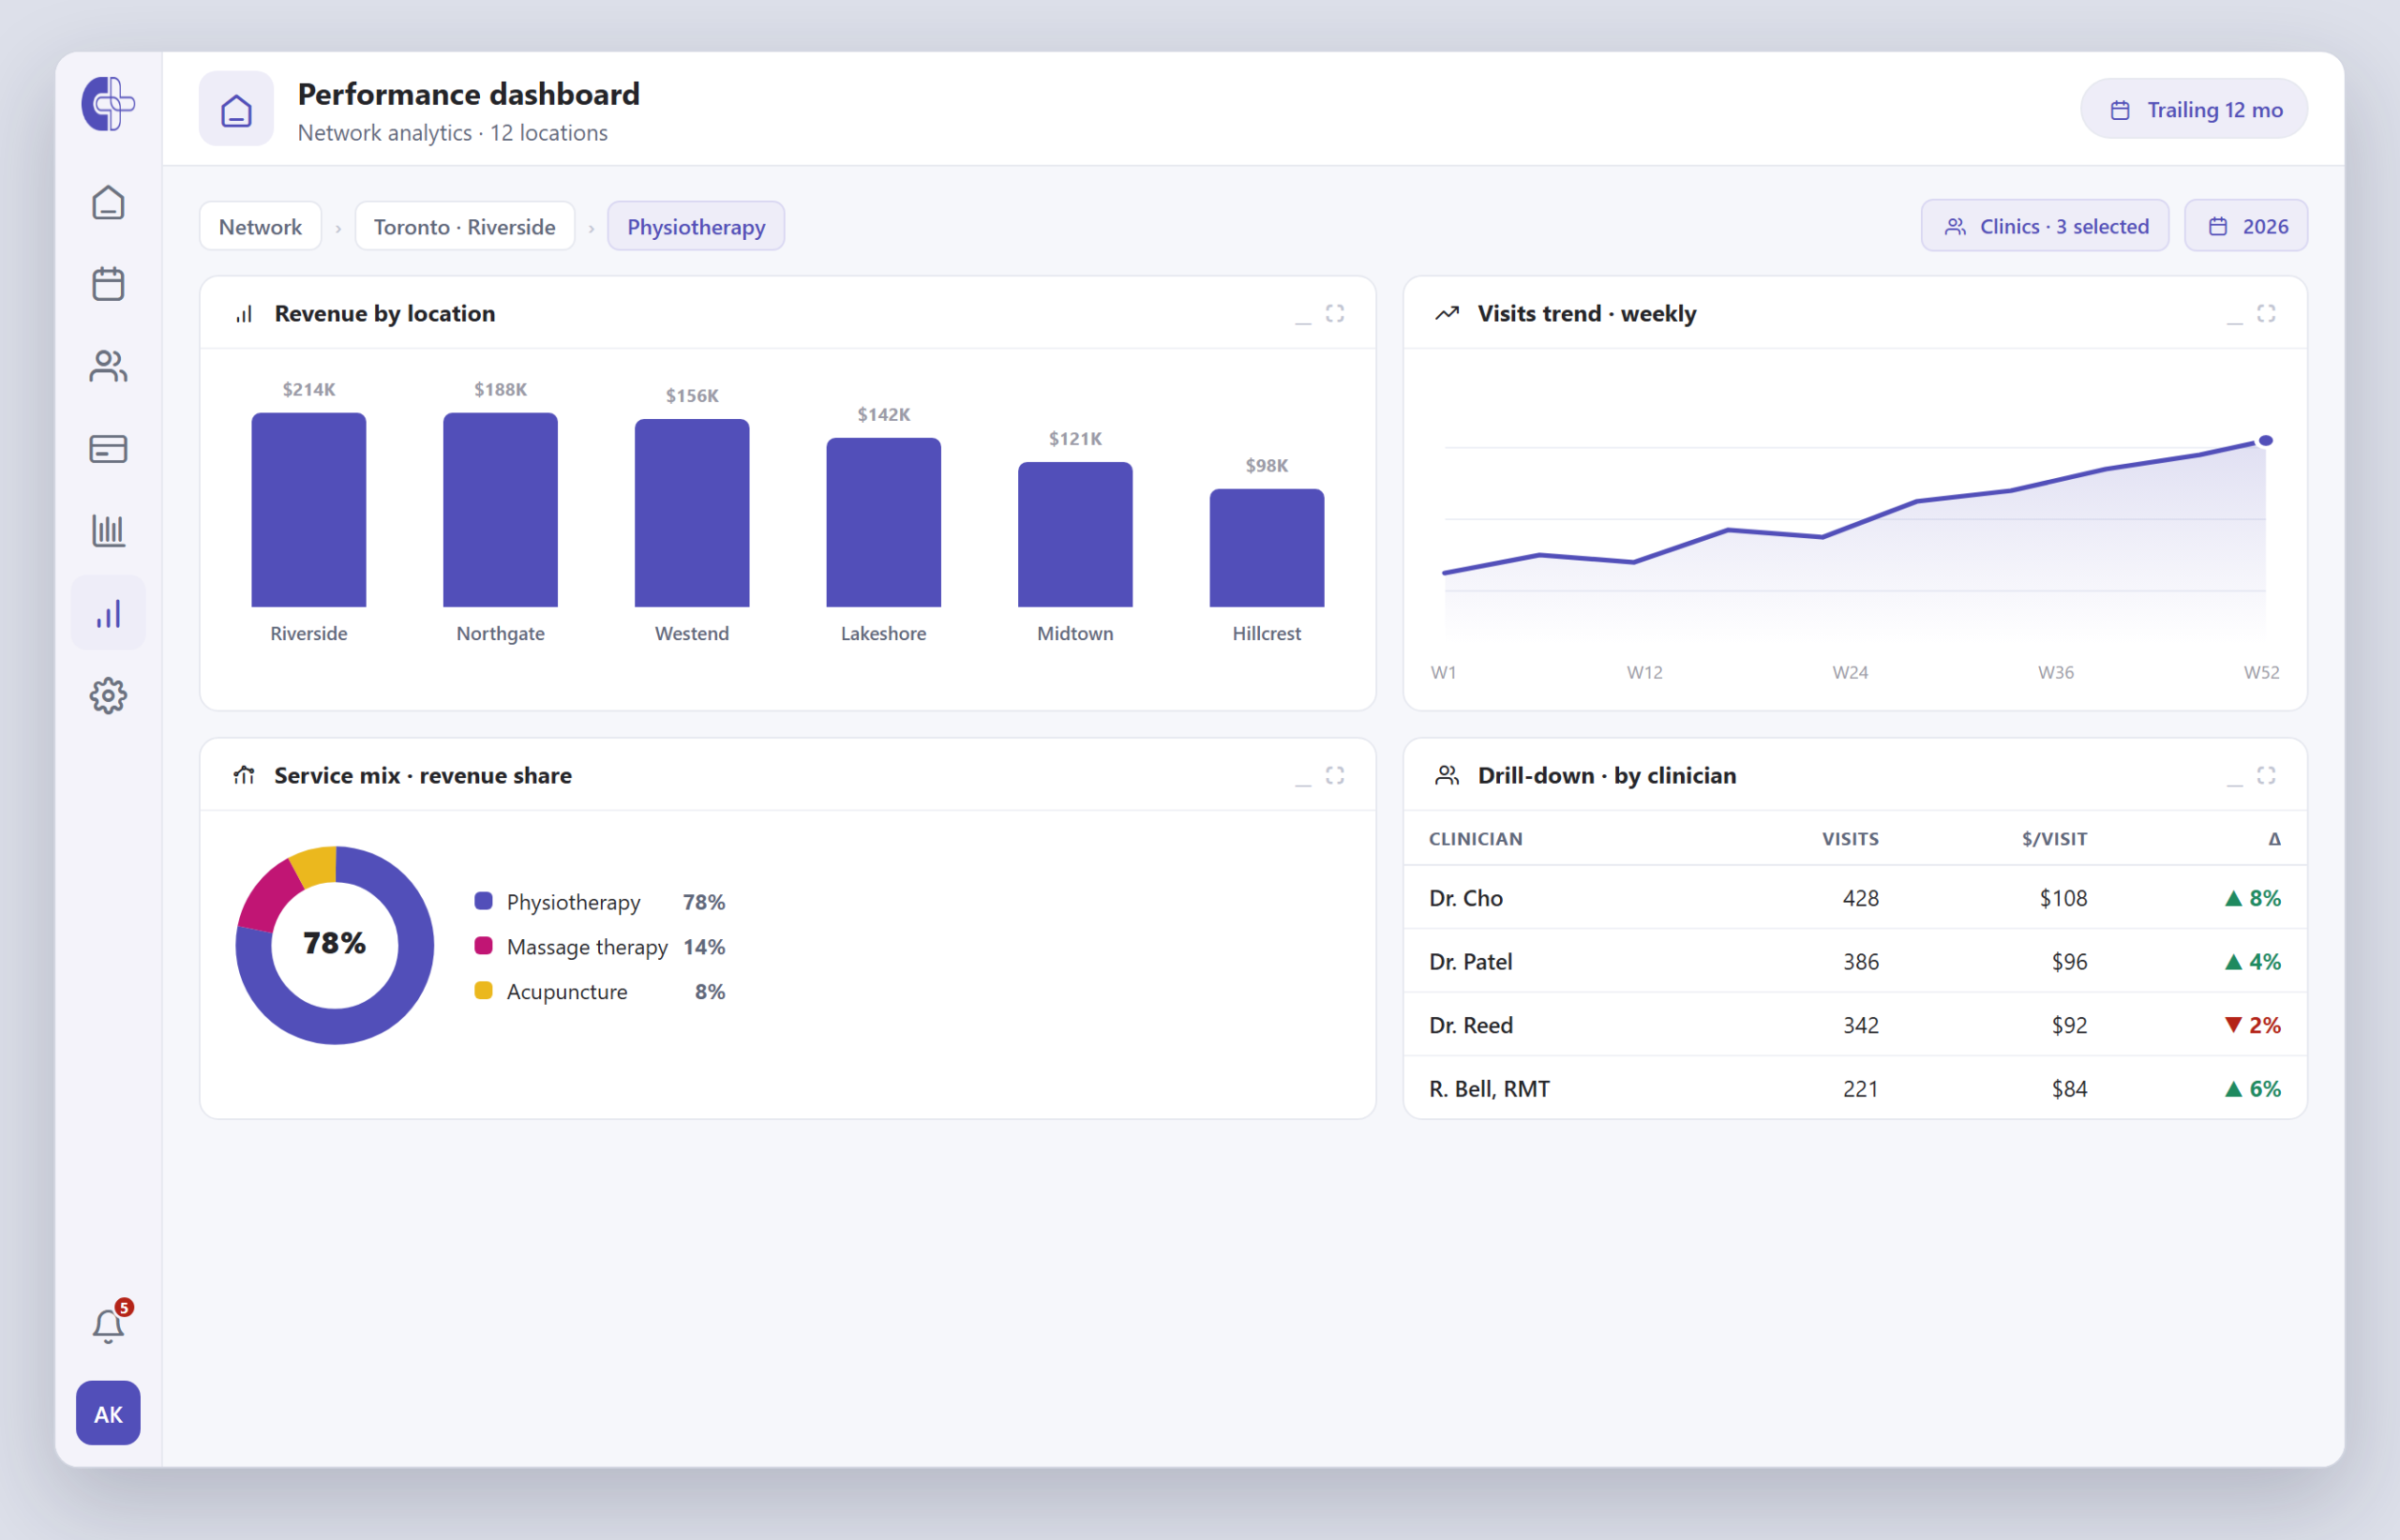
Every number a CFO asks for — drawn straight from your clinics. Role-based KPI dashboards, real-time revenue tracking, patient-flow analytics and customizable reports — all on data pulled live from scheduling, EMR and billing. One source of truth, network to chair.
Clinic analytics & business intelligence software
Clinic analytics software turns a clinic's scheduling, EMR and billing data into real-time dashboards and reports, so owners and managers can track revenue, utilization, patient flow and goals across locations — without manual spreadsheets. Because Clinicmaster's analytics are native to the platform, data updates in real time with no CSV exports or nightly batch.
One analytics engine. Every workflow feeding it.
Six capabilities that replace the patchwork of Excel cashflow models, third-party BI tool, monthly board deck, and back-of-the-envelope KPI math your leadership team is doing today.
Role-based KPI dashboards
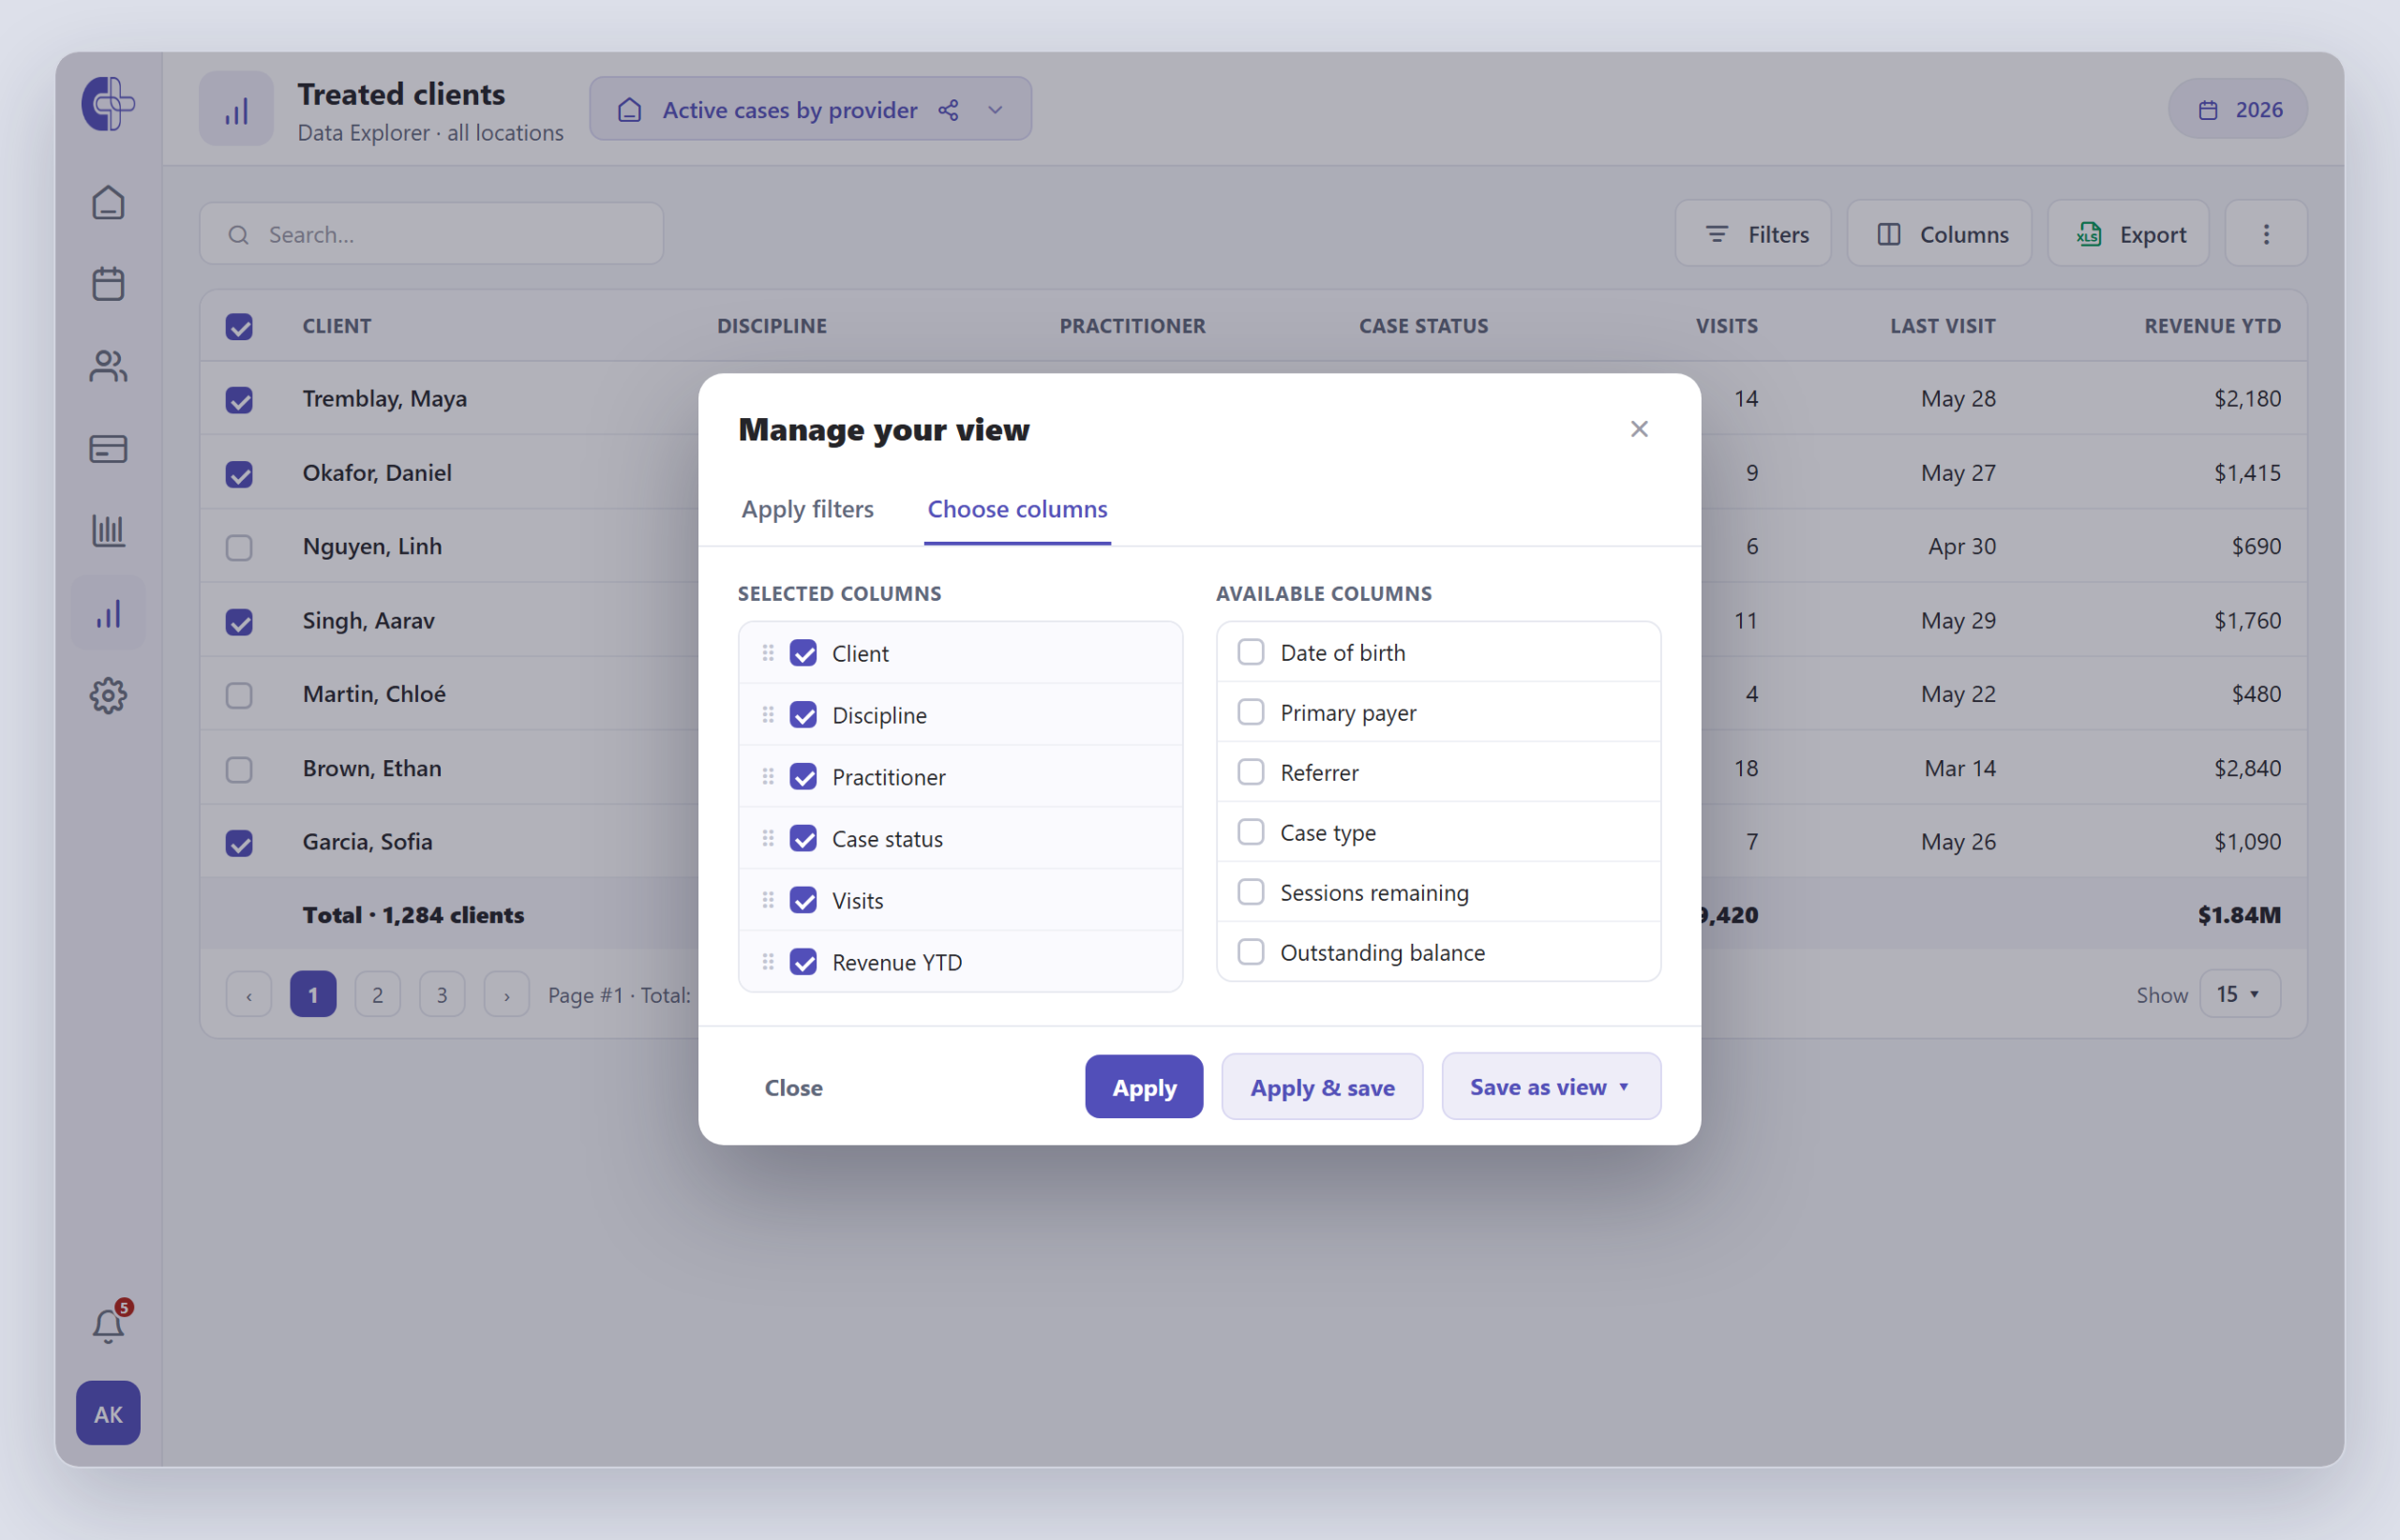
Pre-built dashboards for clinical, operational and financial metrics — one view per role, per location. Plus reports you customize: choose columns, filter, save and share your own views.
Real-time revenue tracking
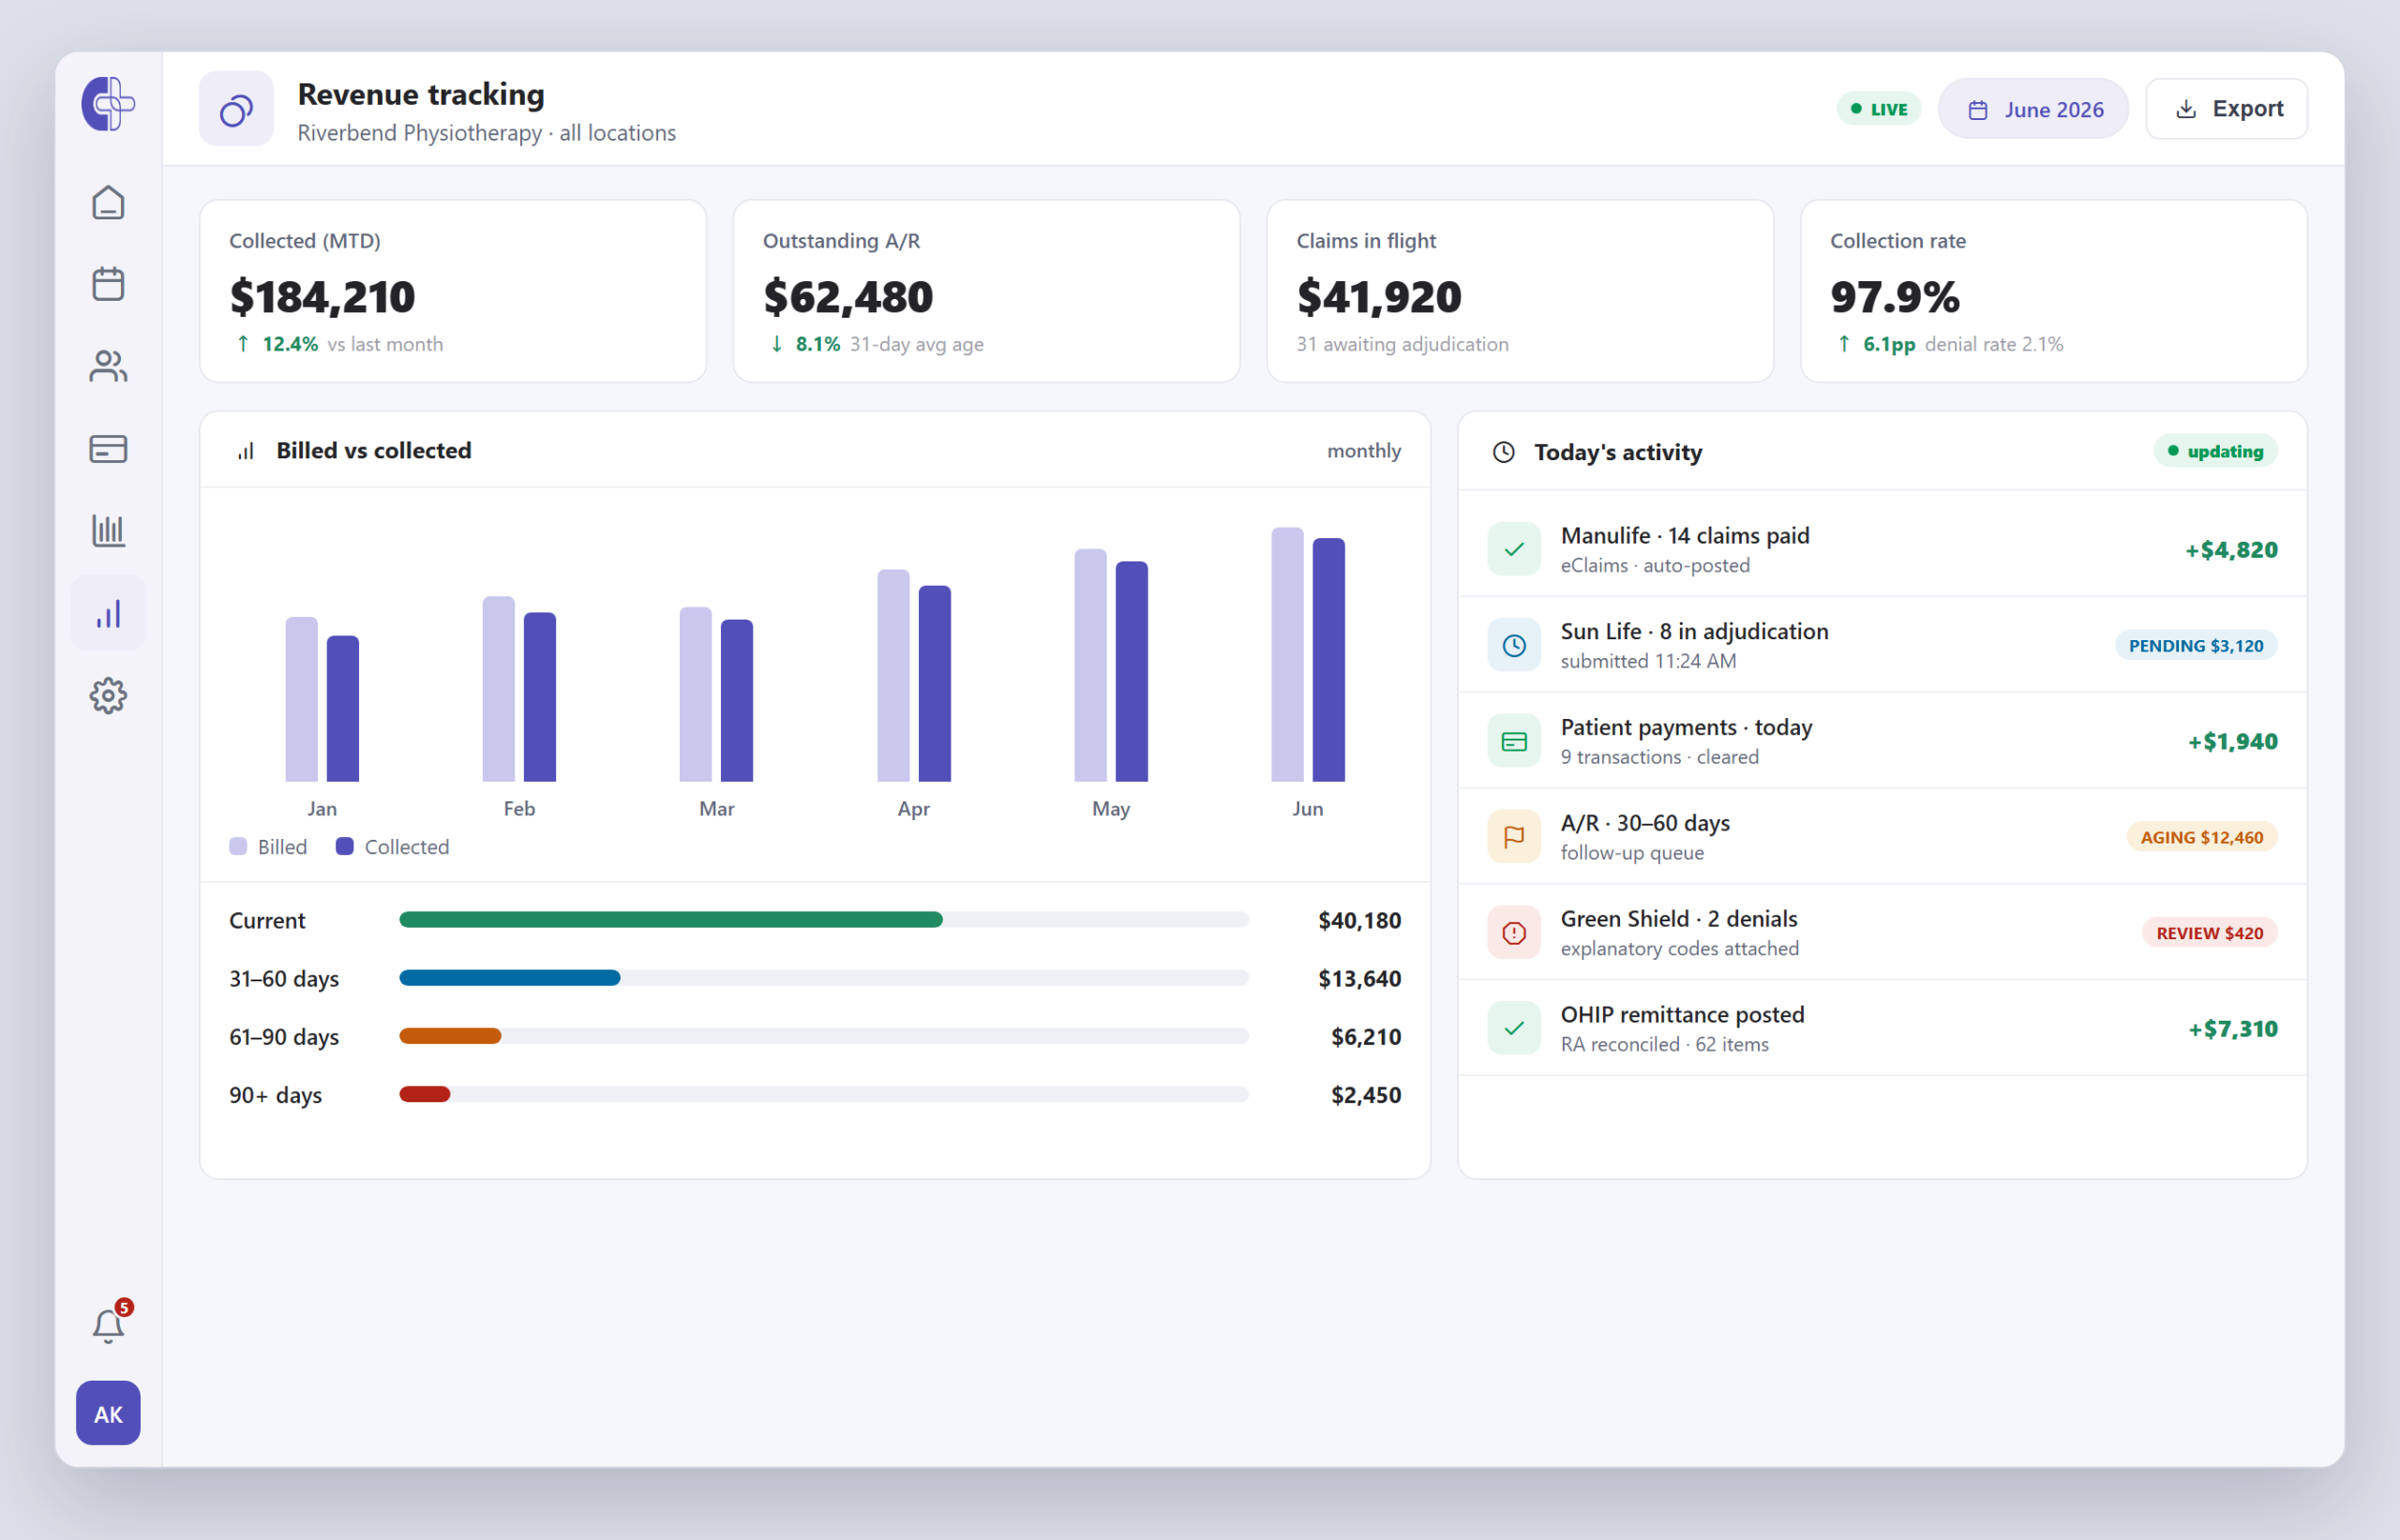
Monitor collections, AR aging and cash-flow bottlenecks as they happen — not at month-end when it's already too late to fix.
Patient flow analytics
Understand wait times, cancellations, no-shows and appointment trends across providers and locations.
Goal tracking & targets
Set revenue and visit targets by clinic, discipline, provider and month — then track actuals against goal in real time, all quarter long.
Service performance analysis
Identify your highest-revenue services and underperforming offerings — by clinic, by clinician, by season.
Export & share
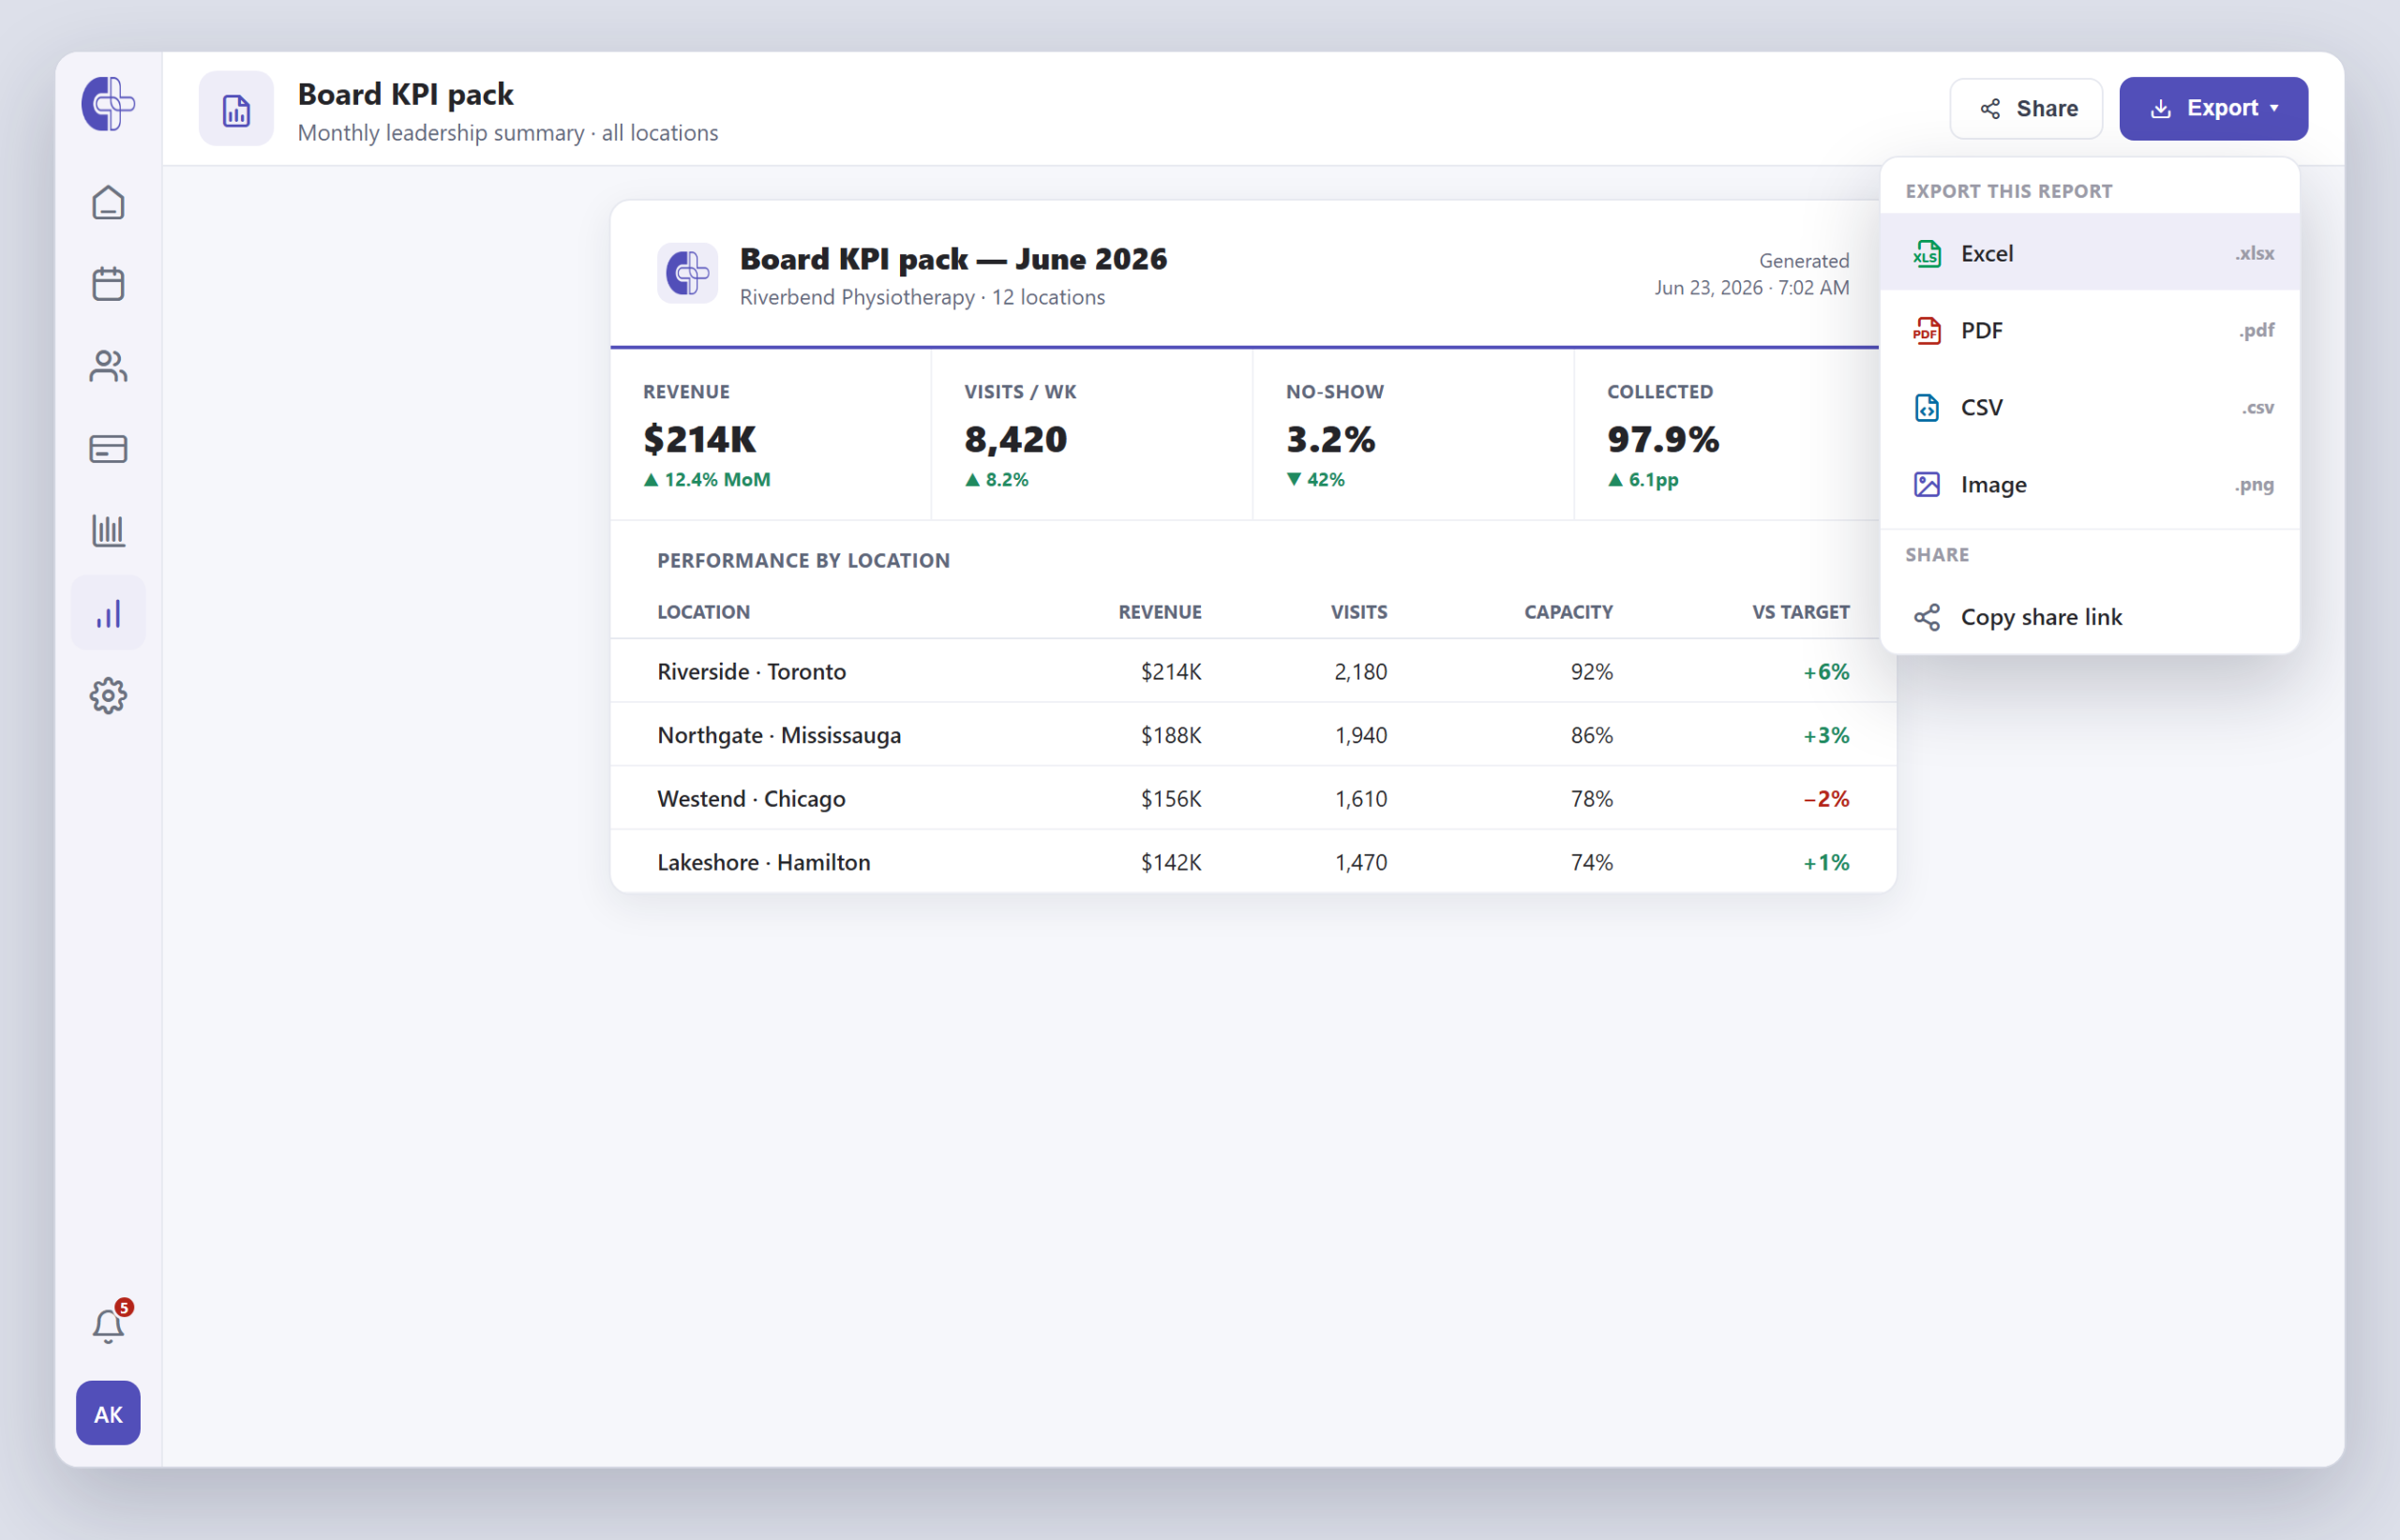
Export any dashboard or report to Excel, CSV, PDF or image — the board pack, the funder report, the manager scorecard, ready to send in a click.
Replace the Monday-morning spreadsheet ritual.
Scheduling, EMR and billing feed the analytics engine directly. No nightly batch, no manual export — your dashboards are always current, and they drill from network-level down to a single chair on a single Tuesday. Scroll to walk through it.
A view for every role — and reports you shape yourself.
Pre-built dashboards for the CFO, the clinic manager, the clinical director — each with their own KPIs and access scope. Need a different cut? Build a report view: choose columns, apply filters, save and share it with your team.
- Pre-built dashboards per role
- Choose columns & apply filters
- Save & share custom views
Cash flow without the lag.
Collections, AR aging and exceptions update as claims clear. Bottlenecks surface the moment they form — not in next month's board pack.
- Collections & A/R aging, live
- Exceptions surface instantly
- No month-end reconciliation
One filter takes you from "all locations" to a single chair.
Network → clinic → discipline → clinician → day. Same dashboard, same metrics, just zoomed in to the right level.
- Network → clinic → clinician drill
- Consolidated multi-location view
- Same metrics at every level
The board pack, the funder report — exported in a click.
Export any dashboard or report to PDF, Excel, CSV or image — the board pack, the funder report, the manager scorecard — formatted and ready to send. No more rebuilding it by hand every month.
- Excel, CSV, PDF or image
- Board packs & funder reports
- Share saved views across the team
Stop reporting on last quarter. Start planning the next one.
Patient-flow funnels, service performance, goal tracking and patient segments — built in, no data team required. Pulls signal from the same data that powers the dashboards. Scroll to walk through it.
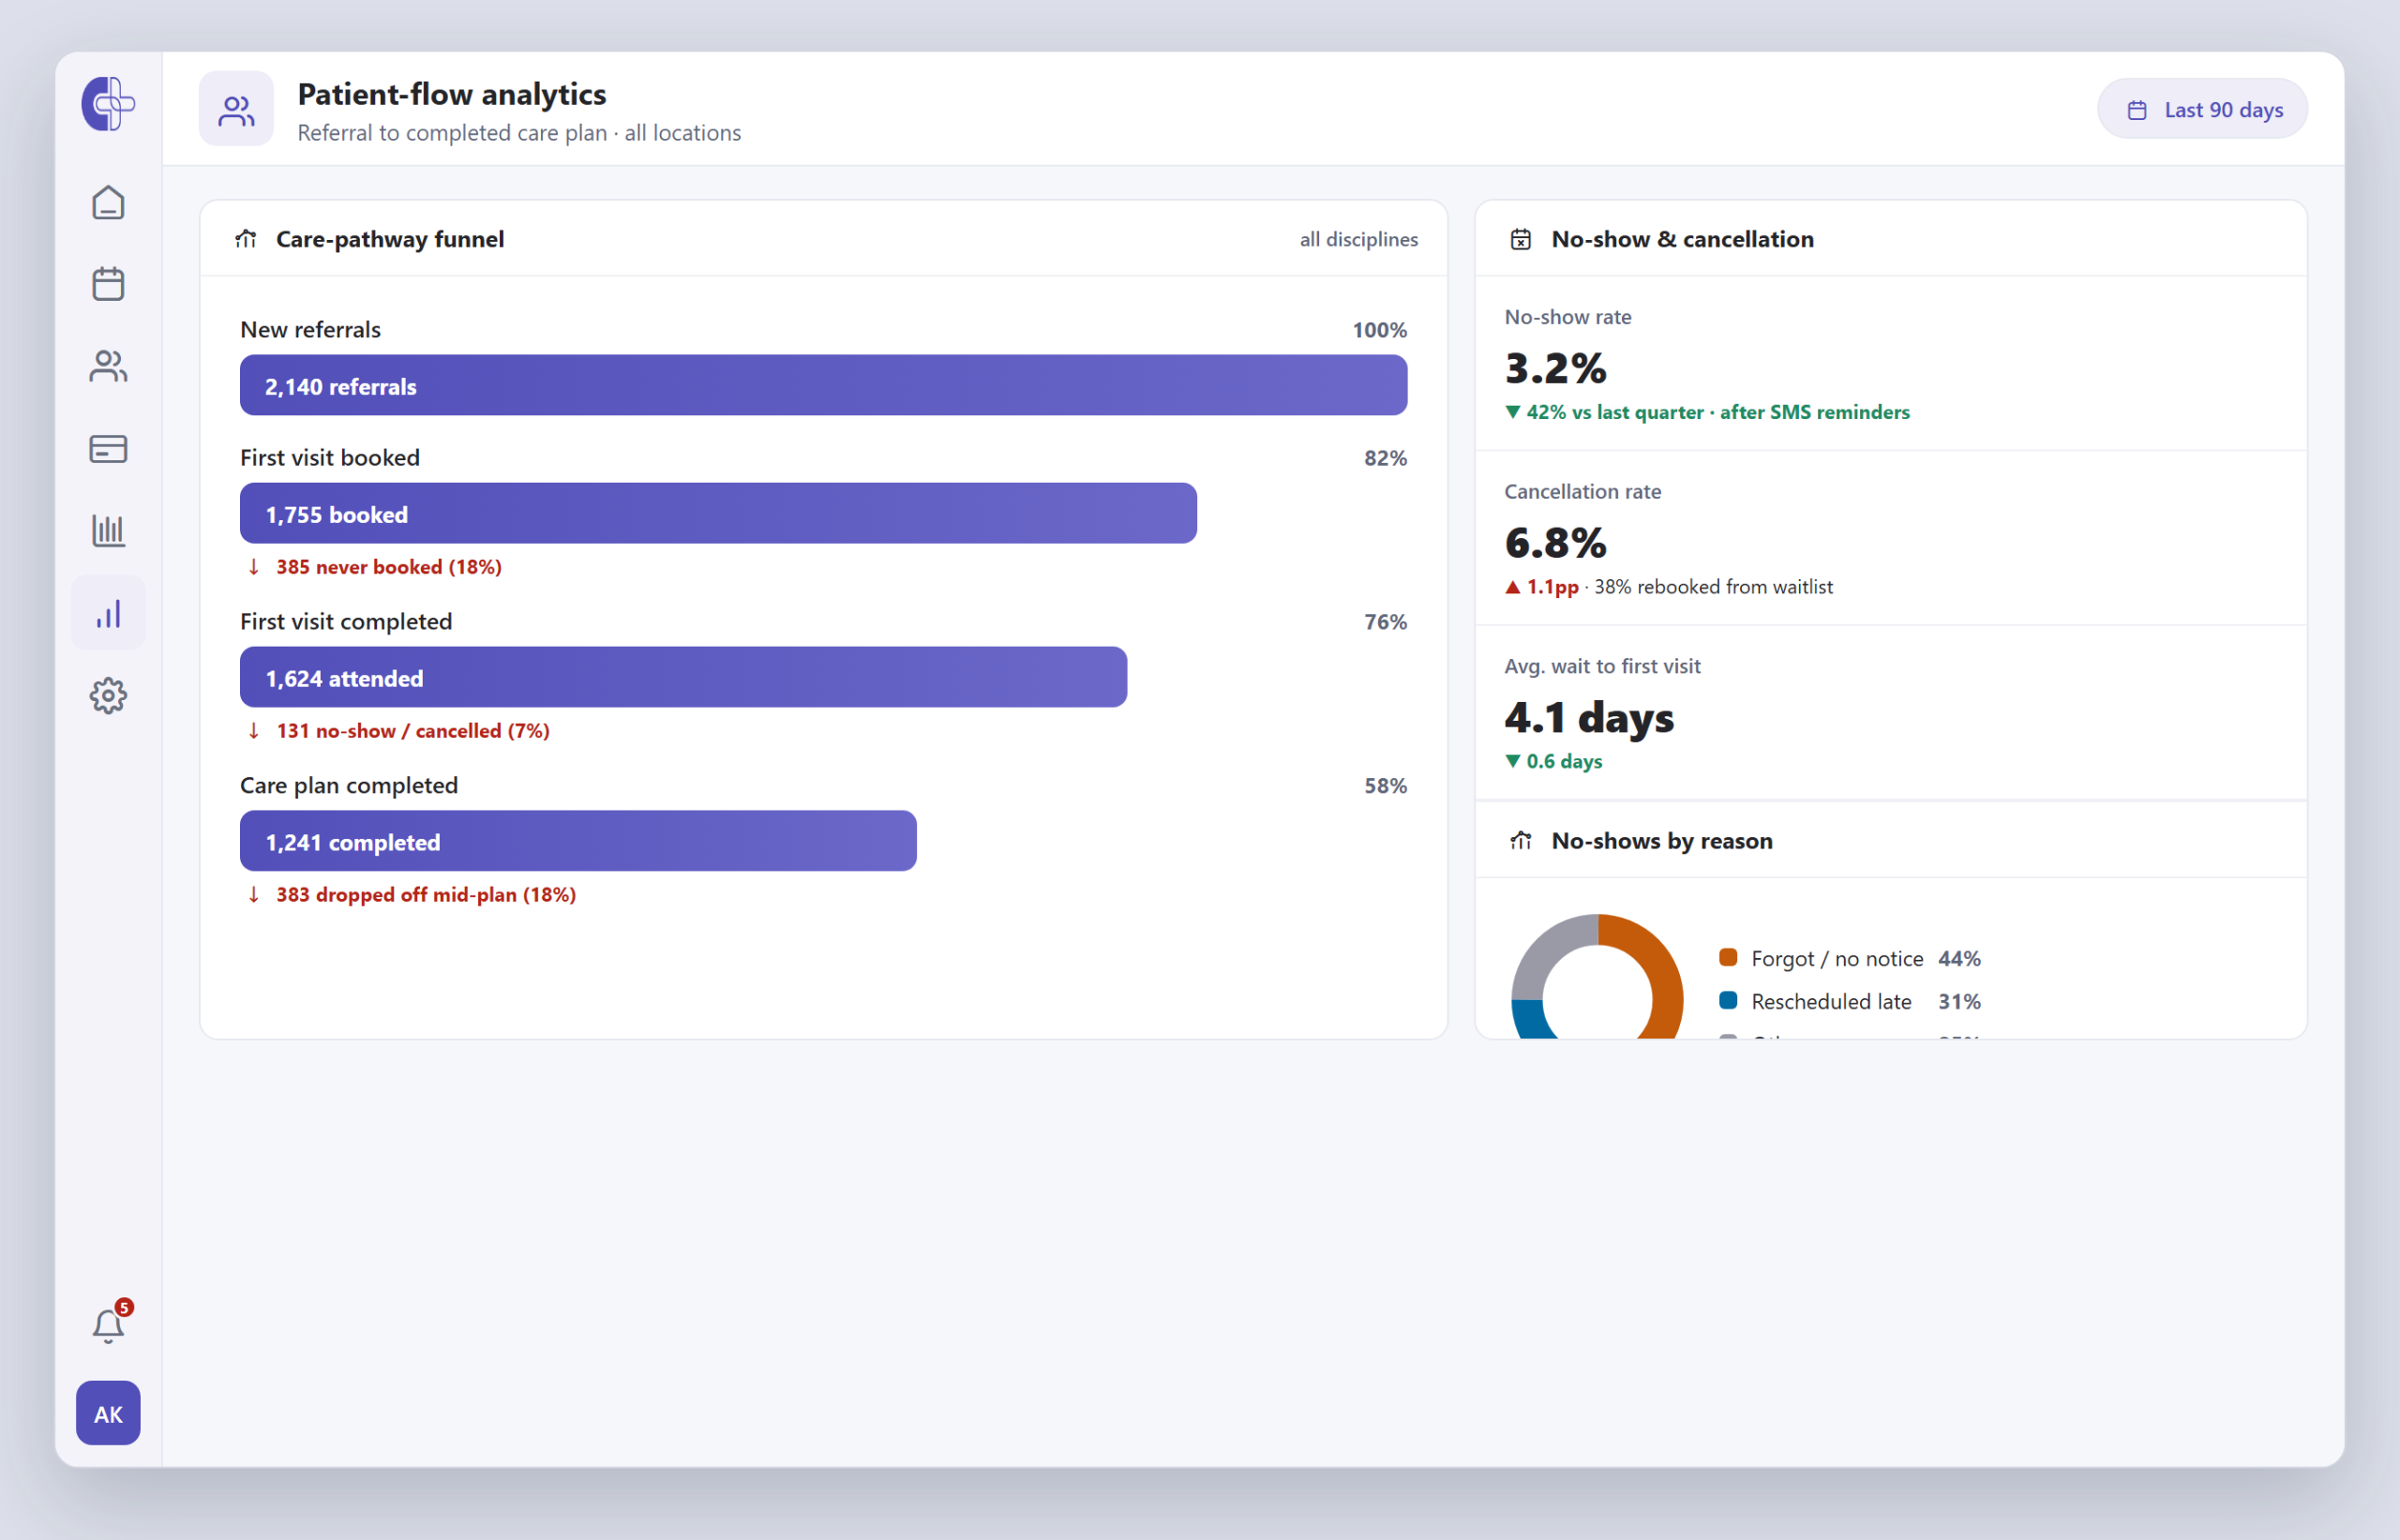
Where patients drop off — and what it's costing you.
Visualize the journey from new referral through completed care plan. See cancellation, no-show and drop-off rates at every step, per location and provider.
- Care-pathway funnel by step
- No-show & cancellation rates
- Per-location, per-provider
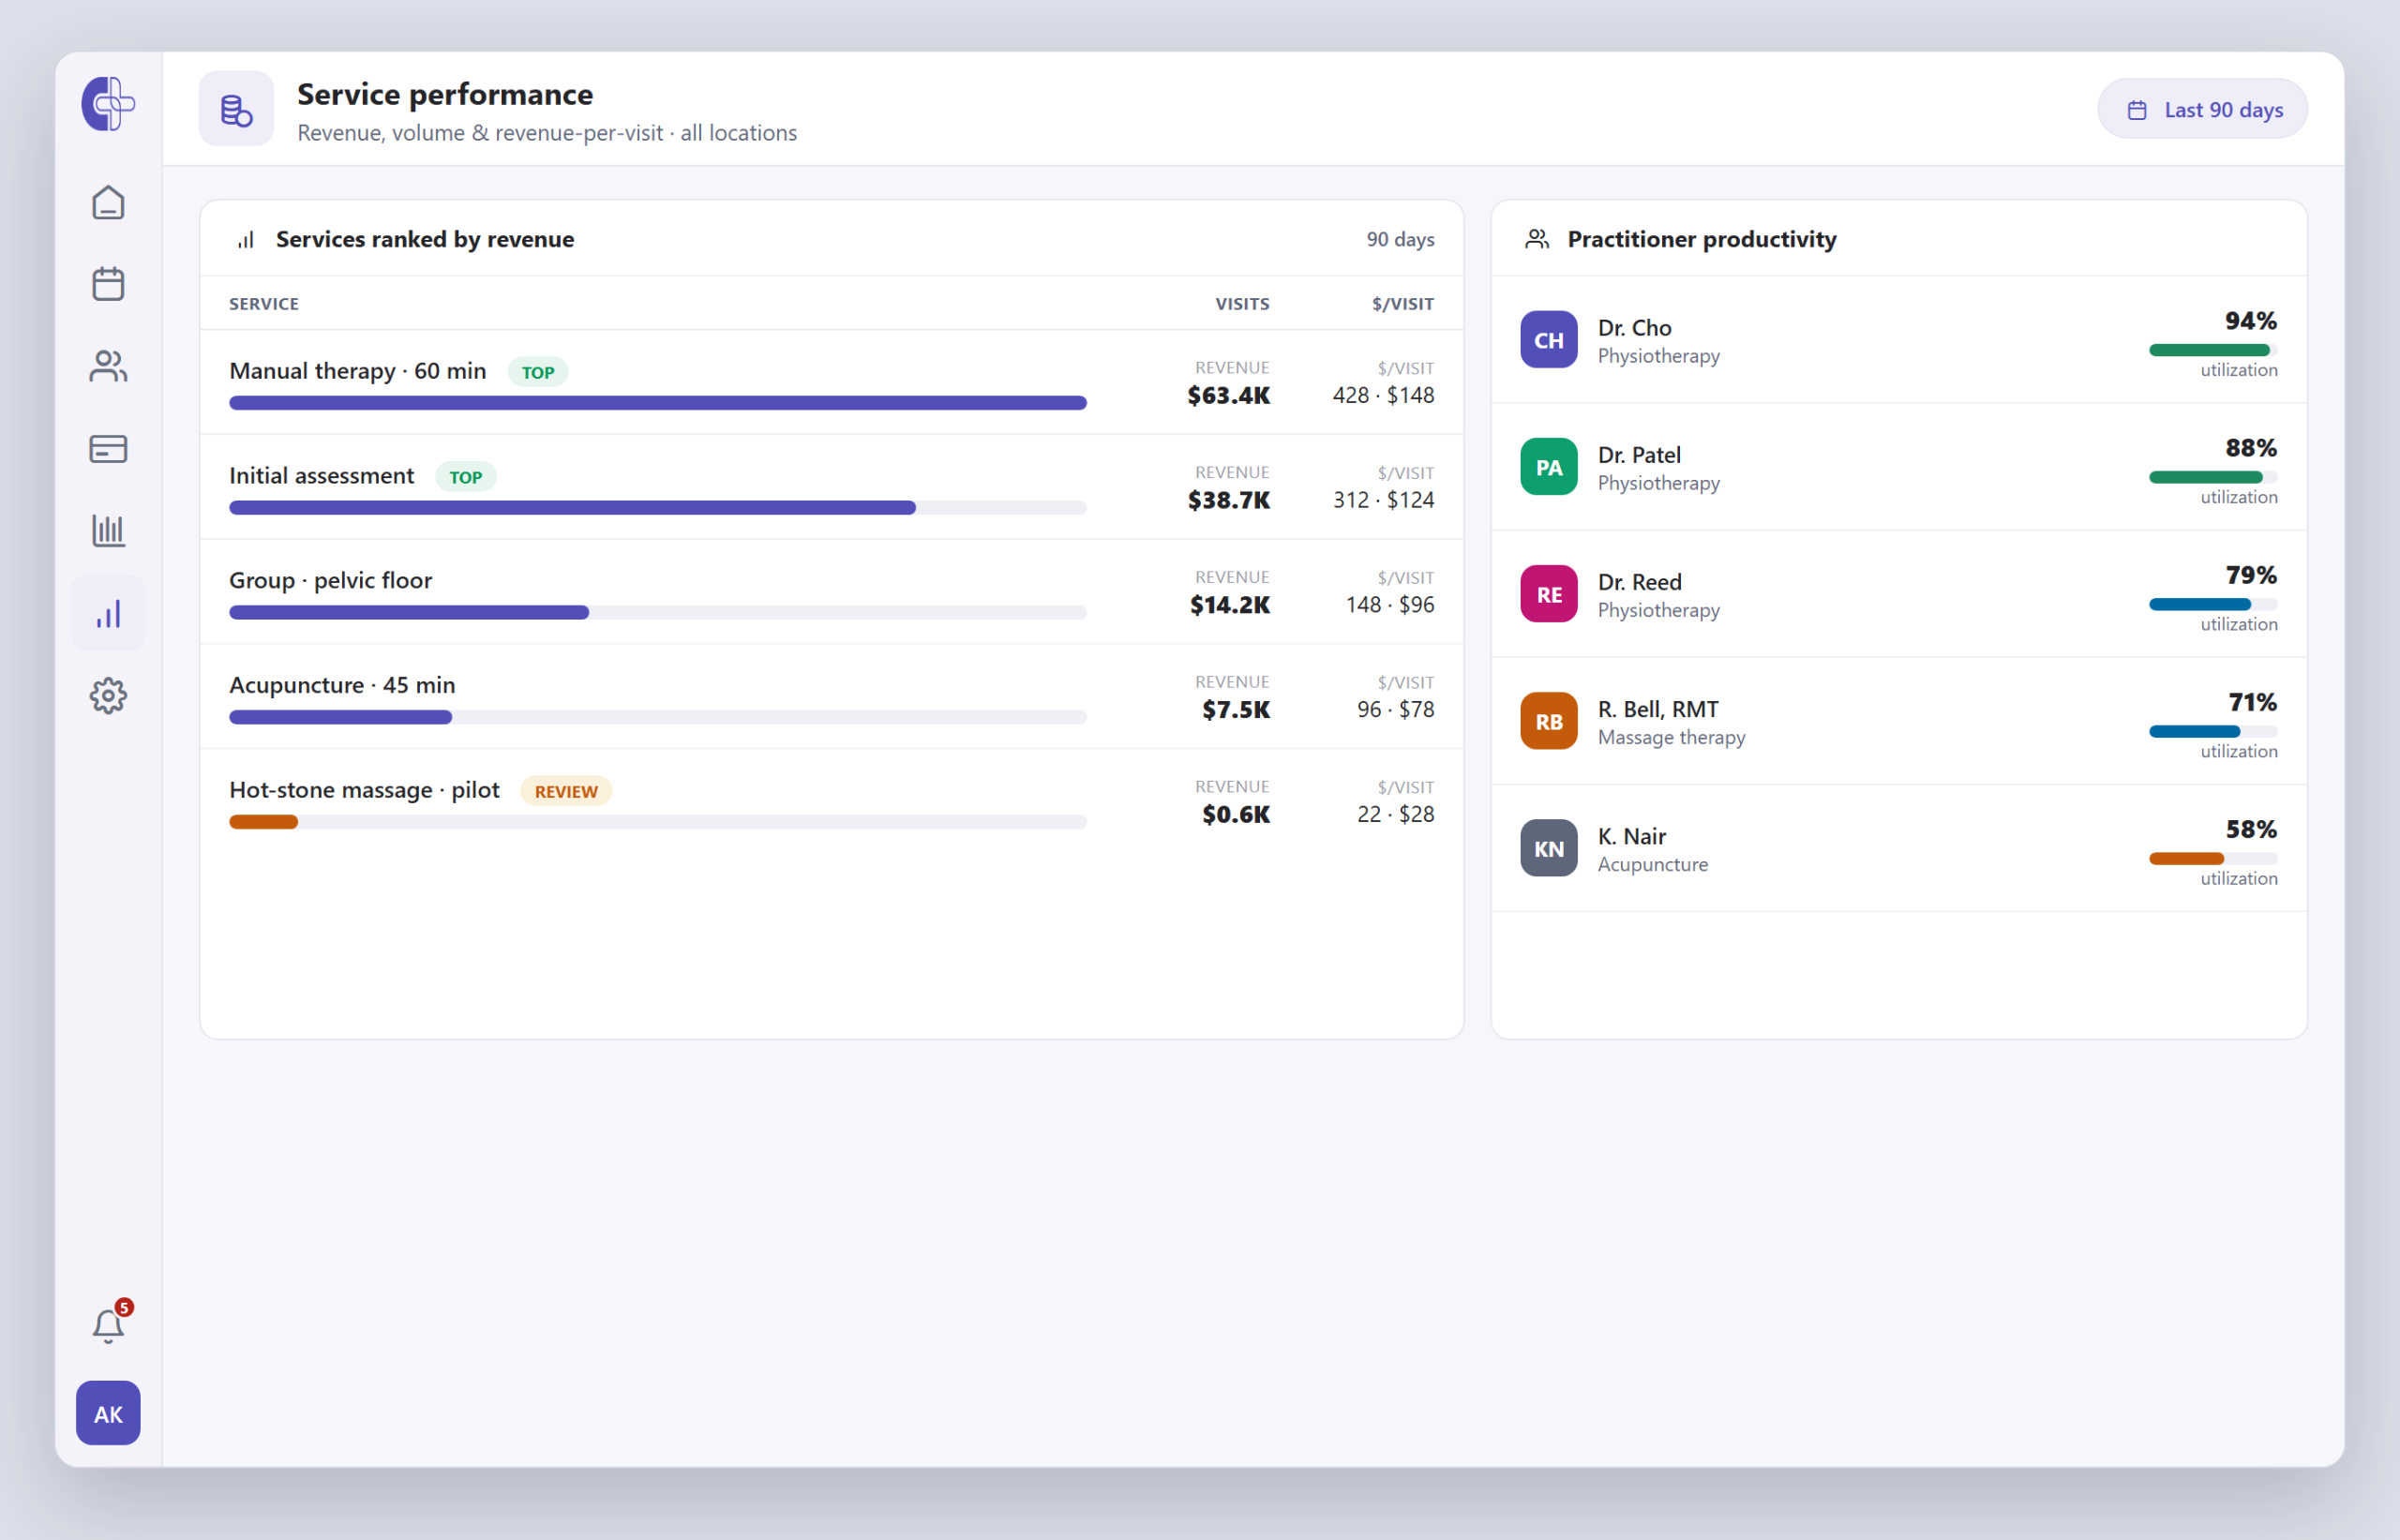
Know which services carry the practice — and which don't.
Ranks every service line by revenue, volume and revenue-per-visit. Surface the services to invest in, and the underperformers to rethink.
- Revenue, volume & revenue-per-visit
- Top performers vs. review flags
- Practitioner productivity
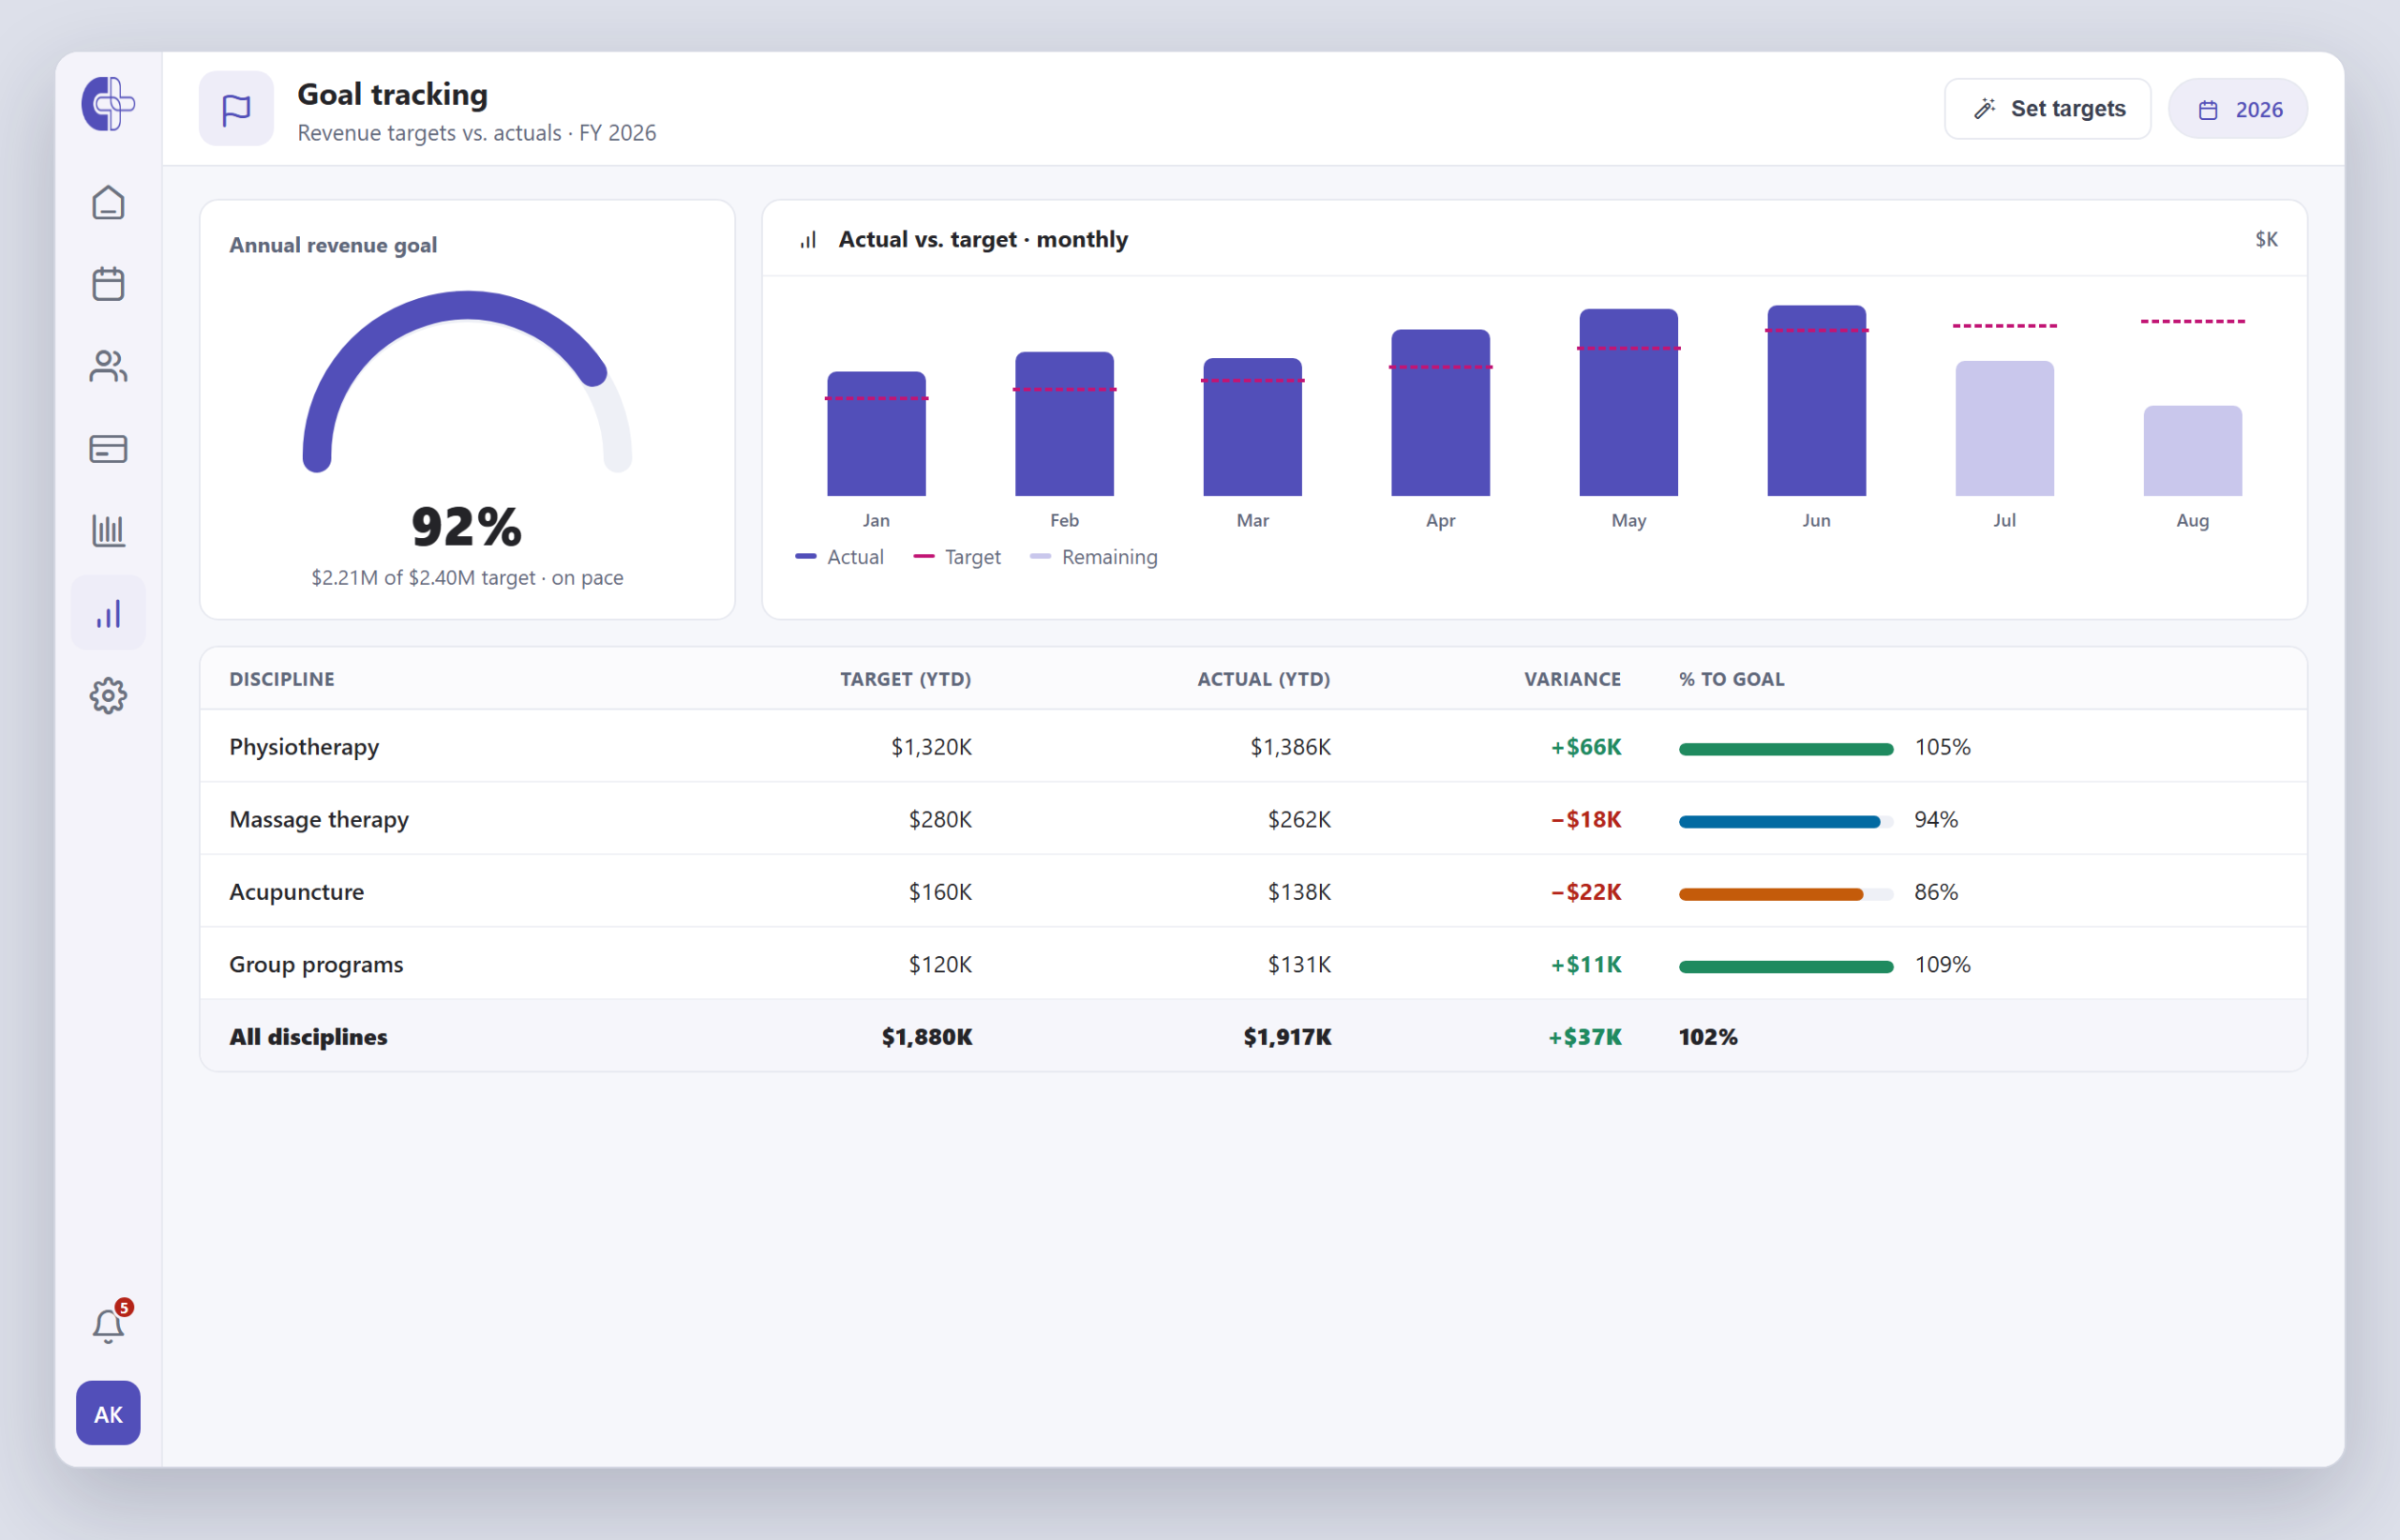
Set the target. Watch actuals close the gap.
Set revenue and visit goals by clinic, discipline, provider and month, then track actuals against target in real time. Right-size staffing and spot the gap to plan well before quarter-end.
- Targets by clinic, discipline & month
- Actual-vs-target, live
- Variance & percent-to-goal
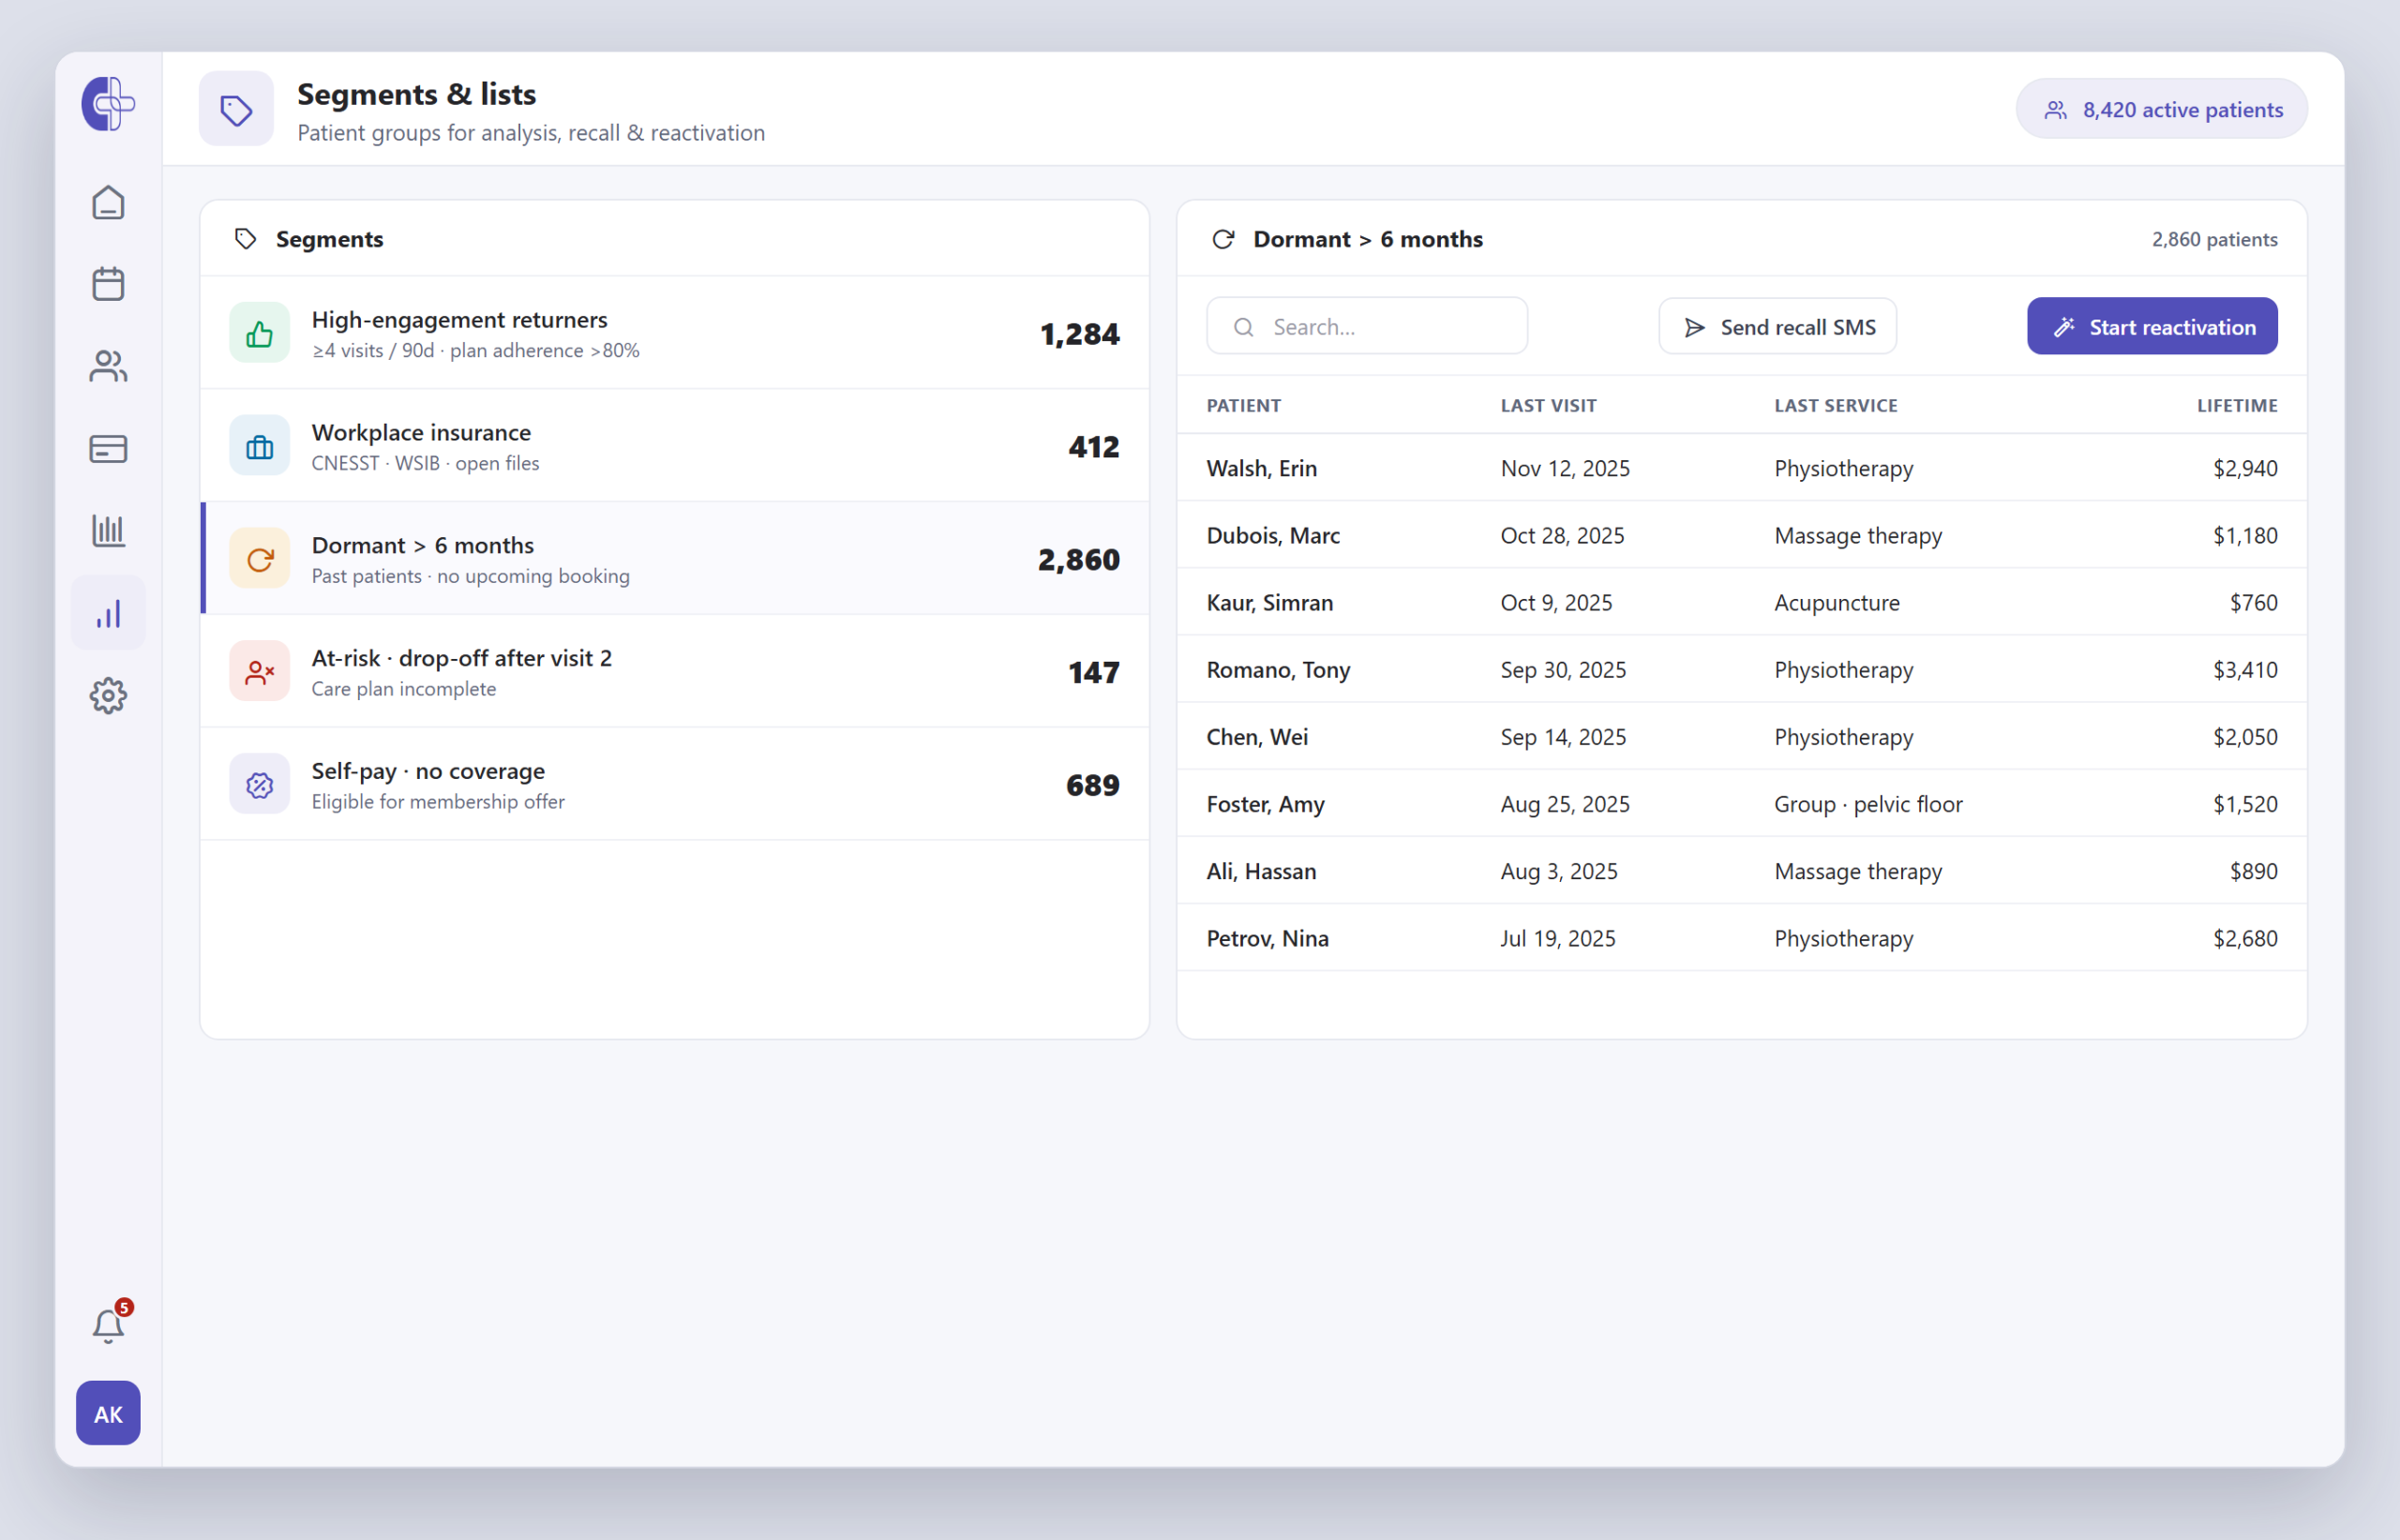
See the patient mix behind the numbers.
Group patients into marketing segments, reactivation lists and at-risk follow-ups — by payer, visit history and case status. Spot high-engagement groups and dormant patients to win back.
- Marketing segments & lists
- Reactivation & at-risk follow-ups
- By payer, visits & case status
Six things your leadership team is tired of guessing about.
What leaders actually want from analytics.
I want to track patient visit averages and reactivations — and lift satisfaction while I'm at it.
We need to know which services are the most profitable across the whole practice.
I want to set revenue targets and plan staffing against them, quarter by quarter.
Built for the people answering "how's the business?"
Practice managers
Operational visibility — wait times, no-shows, provider utilization — without rebuilding the Monday spreadsheet.
Providers & clinical leads
Outcome metrics, plan adherence and panel mix per clinician — to coach without guesswork.
Multi-location clinics
Consolidated reporting across every location, side-by-side comparison, and drill-down to the chair level.
Executives & CFOs
Live revenue, goal tracking and service performance — the numbers the board asks about, ready before the meeting.
- Drill down to provider-level performance
- Compare historical data for seasonality trends
- Export to Excel, CSV, PDF or image
- Save and share custom report views across your team
Questions analytics leaders ask us.
Scale your Organization with Clinicmaster.
30-minute working session with a solutions engineer. Bring your current numbers — we'll show you the gap.